Datoteka:Sauerstoffgehalt-1000mj2.png

Izvorna datoteka (2.000 × 1.409 piksela, veličina datoteke/fajla: 74 kB, MIME tip: image/png)
| Opis |
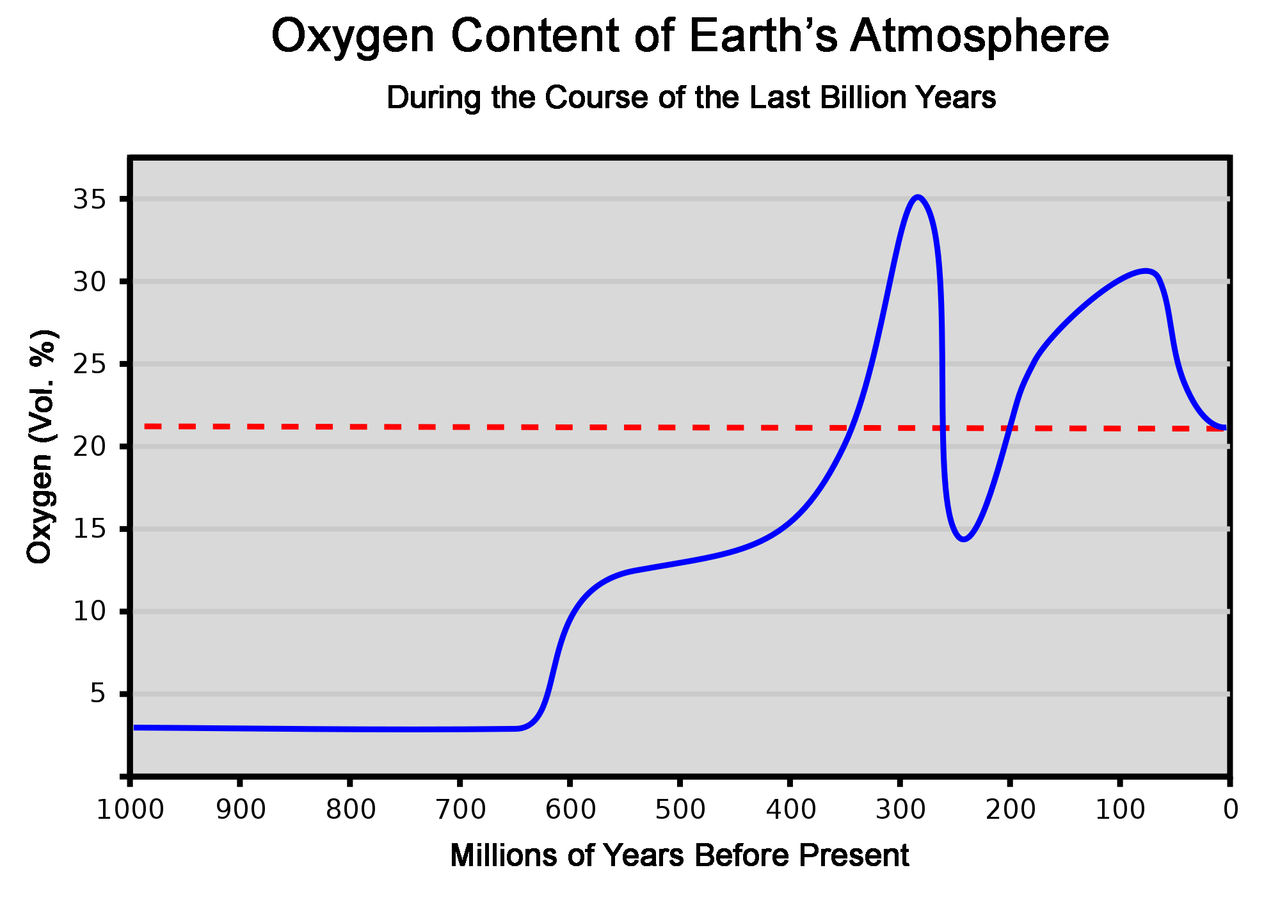
This graph represents the concentration of oxygen in the atmosphere over the last 1000 million years. As a reference, the dashed red line shows the present concentration of 21%. It should be noted that the O2 concentration variation which occurred in past periods can often be estimated only relatively coarsely. Therefore, the chart makes no claim to accuracy, but can only give a broad overview of change at the level of geological periods. This chart is based on the averaged data of several publications. [1][2] Explanation of the curve: After having already begun in the Precambrian, the outgassing of oxygen from the oceans caused atmospheric oxygen to jump from 3% to 12% around the beginning of the Cambrian, because by then all oxygen sinks were finally saturated. Around the same time, the Cambrian explosion took place. During the Silurian and Devonian plants spread over the land, while the animal kingdom was still almost exclusively confined to the water. This caused a further rapid and continuous increase of the oxygen concentration. In the following period carbon burial brought the oxygen level to 35%,[3] thus favoring overgrowth especially in insects. Amphibians and early reptiles were now present on land. Massive volcanic activity at the Permian-Triassic transition caused not only a decline of the oxygen content to 15%, but also the largest mass extinction in geological history. The oxygen concentration then recovered over a long period and reached 26% again by the middle of the Jurassic, and probably even rose to 30% in the Cretaceous. During this time the largest dinosaurs evolved. The end of the Cretaceous period is marked by an impact event, with climate change and a mass extinction. The oxygen level was only 23% 40 million years ago, and had reached the present value of 21% by 25 million years ago. Since then the level has remained constant, apart from fluctuations in the per thousand range. |
| Datum | (UTC) |
| Izvor | |
| Autor |
|
| Ostale verzije | Radovi izvedeni od ove datoteke: OxygenLevel-1000ma.svg |
| Ovo je retuširana slika, što znači da je digitalno izmjenjena u odnosu na svoju izvornu inačicu. Izmjene: Translated text to English. Izvornik se može vidjeti ovdje: Sauerstoffgehalt-1000mj.svg. Izmjene je napravio: WolfmanSF.
|
| Ja, vlasnik autorskog prava ovog djela, objavljujem ovaj rad u javno vlasništvo. Ovo se primjenjuje u cijelom svijetu. U nekim državama ovo zakonski nije moguće; u tom slučaju: Ja dopuštam svima pravo korištenja ovog rada u bilo koju svrhu, bez ikakvih uslova, osim ako su takvi uslovi zakonski neophodni. |
Izvorna evidencija postavljanja
This image is a derivative work of the following images:
- File:Sauerstoffgehalt-1000mj.svg licensed with PD-self
- 2007-10-27T01:17:42Z LordToran 744x524 (41527 Bytes) '
- 2007-07-23T00:08:15Z LordToran 744x524 (42518 Bytes) == Beschreibung == {{Information |Description=Dieses Diagramm stellt die Sauerstoffkonzentration in der Erdatmosphäre im Lauf der letzten Jahrmilliarde dar. Es ist anzumerken, dass die Zeiträume, in denen vergangene Schwan
- 2007-07-17T23:57:50Z LordToran 744x524 (41203 Bytes) {{Information |Description=Dieses Diagramm stellt die Sauerstoffkonzentration in der Erdatmosphäre im Lauf der letzten Jahrmilliarde dar. |Source=Selbst erstellt |Date=2007-07-18 |Author=[http://de.wikipedia.org/wiki/Benutze
Uploaded with derivativeFX
Historija datoteke
Kliknite na datum/vrijeme da biste vidjeli tadašnju verziju datoteke.
| Datum/vrijeme | Minijatura | Dimenzije | Korisnik | Komentar | |
|---|---|---|---|---|---|
| aktualna | 12:31, 11 mart 2010 | | 2.000 × 1.409 (74 kB) | WolfmanSF | {{Information |Description=Dieses Diagramm stellt die Sauerstoffkonzentration in der Erdatmosphäre im Lauf der letzten Jahrmilliarde dar. Als Referenz zeigt die gestrichelte rote Linie die heutige Konzentration von 21% an. Es ist anzumerken, dass die Ze |
Upotreba datoteke
Sljedeća stranica koristi ovu datoteku:
Globalna upotreba datoteke
Ovu datoteku upotrebljavaju i sljedeći projekti:
- Upotreba na projektu cdo.wikipedia.org
- Upotreba na projektu en.wikipedia.org
- Upotreba na projektu fi.wikipedia.org
- Upotreba na projektu ha.wikipedia.org
- Upotreba na projektu hr.wikipedia.org
- Upotreba na projektu ja.wikipedia.org
- Upotreba na projektu mk.wikipedia.org
- Upotreba na projektu no.wikipedia.org
- Upotreba na projektu pt.wikipedia.org
- Upotreba na projektu ru.wikipedia.org
- Upotreba na projektu simple.wikipedia.org
- Upotreba na projektu sk.wikipedia.org
- Upotreba na projektu sr.wikipedia.org
- Upotreba na projektu sv.wikipedia.org
- Upotreba na projektu uk.wikipedia.org
- Upotreba na projektu www.wikidata.org
- Upotreba na projektu zh.wikipedia.org