Datoteka:1000 Year Temperature Comparison.png

1000_Year_Temperature_Comparison.png(599 × 442 piksela, veličina datoteke/fajla: 32 kB, MIME tip: image/png)

Ova datoteka je s projekta Vikimedijina ostava i može se upotrebljavati i na drugim projektima. Ispod su prikazane informacije s njene opisne stranice.

This graph image could be re-created using vector graphics as an SVG file. This has several advantages; see Commons:Media for cleanup for more information. If an SVG form of this image is available, please upload it and afterwards replace this template with {{vector version available|new image name}}.


It is recommended to name the SVG file “1000 Year Temperature Comparison.svg”—then the template Vector version available (or Vva) does not need the new image name parameter.

Opis izmjene

Opis
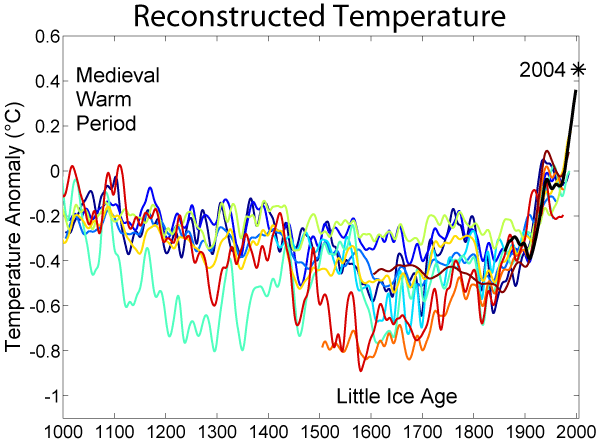
English: This image is a comparison of 10 different published reconstructions of mean temperature changes during the 2nd millennium. More recent reconstructions are plotted towards the front and in redder colors, older reconstructions appear towards the back and in bluer colors. An instrumental history of temperature is also shown in black. The medieval warm period and little ice age are labeled at roughly the times when they are historically believed to occur, though it is still disputed whether these were truly global or only regional events. The single, unsmoothed annual value for 2004 is also shown for comparison. (Image:Instrumental Temperature Record.png shows how 2004 relates to other recent years).

It is unknown which, if any, of these reconstructions is an accurate representation of climate history; however, these curves are a fair representation of the range of results appearing in the published scientific literature. Hence, it is likely that such reconstructions, accurate or not, will play a significant role in the ongoing discussions of global climate change and global warming.

For each reconstruction, the raw data has been decadally smoothed with a σ = 5 yr Gaussian weighted moving average. Also, each reconstruction was adjusted so that its mean matched the mean of the instrumental record during the period of overlap. The variance (i.e. the scale of fluctuations) was not adjusted (except in one case noted below).

Except as noted below, all original data for this comparison comes from here and links therein. It should also be noted that many reconstructions of past climate report substantial error bars, which are not represented on this figure.
Datum
Izvor http://www.globalwarmingart.com/wiki/File:1000_Year_Temperature_Comparison.png
Autor Robert A. Rohde
Ostale verzije

Reconstructions

The reconstructions used, in order from oldest to most recent publication are:

  1. (dark blue 1000-1991): The Holocene.
  2. (blue 1000-1980): Geophysical Research Letters.
  3. (light blue 1000-1965): Ambio. Modified as published in Science.
  4. (lightest blue 1402-1960): J. Geophys. Res..
  5. (light green 831-1992): Science.
  6. (yellow 200-1980): Geophysical Research Letters. doi:10.1029/2003GL017814.
  7. (orange 200-1995): Reviews of Geophysics. doi:10.1029/2003RG000143
  8. (red-orange 1500-1980): Geophys. Res Lett.. doi:10.1029/2004GL019781
  9. (red 1-1979): Nature. doi:10.1038/nature03265
  10. (dark red 1600-1990): Science. doi:10.1126/science.1107046

(black 1856-2004): Instrumental data was jointly compiled by the Climatic Research Unit and the UK Meteorological Office Hadley Centre. Global Annual Average data set TaveGL2v [1] was used.

Documentation for the most recent update of the CRU/Hadley instrumental data set appears in: Journal of Climate.

Licenciranje

The original version of this figure was prepared by Robert A. Rohde from publicly available data and is incorporated into the Global Warming Art project.

Image from Global Warming Art
This image is an original work created for Global Warming Art. Please refer to the Year Temperature Comparison.png image description page for more information.
GNU head Dopušteno je umnožavanje, dijeljenje i mijenjanje ovog dokumenta pod uslovima GNU-ove licence za slobodnu dokumentaciju, verzije 1.2 ili bilo koje novije koju objavi Fondacija za slobodni softver; bez nepromjenljivih odjeljaka i bez tekstova na naslovnoj i zadnjoj strani. Tekst licence možete pročitati ovdje.
w:bs:Creative Commons
pripisivanje dijeljenje pod istim uslovima
Ova datoteka dostupna je pod licencom Creative Commons Attribution-Share Alike 3.0 Unported licencom.
Slobodno smijete:
  • dijeliti – umnožavati, raspodjeljivati i prenositi djelo
  • prerađivati – prilagođavati djelo
Pod sljedećim uslovima:
  • pripisivanje – Morate pripisati odgovarajuće autorske zasluge, osigurati link ka licenci i naznačiti jesu li napravljene izmjene. To možete uraditi na bilo koji razumni način, ali ne tako da se sugerira da davalac licence odobrava Vas ili Vašu upotrebu njegovog djela.
  • dijeljenje pod istim uslovima – Ako mijenjate, transformišete ili nadograđujete ovaj materijal, morate ga objaviti i distribuirati samo pod istom ili sličnom licencom poput ove.
Ova oznaka licence je dodana na ovu datoteku kao dio GFDL ažuriranja licence.


Notes

  1. Data from Moberg et al. was taken directly from the supplemental information accompanying the Nature article.
  2. Data for Oerlemans was provided by William M. Connolley.
  3. Esper et al. reported only fluctuations in "arbitrary" units, so the variance in this record was rescaled to match the variance during the period of overlap with the instrumental record.
  4. When a paper included multiple reconstructions, the global annually average temperature data was used. If this was not reported, then Northern Hemisphere annually averaged data was used.
  5. Four records appearing at [2] were not used in preparing this graph for the following reasons:
    1. Mann et al. 98 was not included because Mann et al. 99 extended and updated that record.
    2. Briffa et al. 98 was not included because Briffa et al. 2001 extended and updated that record.
    3. Pollack et al. 98 was not included because the reported data was not found to be in a form that allowed for easy replotting.
    4. Mann et al. 2000 was not used because it did not include an original reconstruction covering at least the Northern Hemisphere.


Dragons flight's Temperature Record Series
This figure is part of a series of plots created by Dragons flight to illustrate
changes in Earth's temperature and climate across many different time scales.
Time Period: 25 yrs | 150 yrs | 1 kyr | 2 kyr | 12 kyr | 450 kyr | 5 Myr | 65 Myr | 500 Myr
For articles related to this topic see: Temperature record

Opisi

Dodajte objašnjenje u jednom redu što predstavlja ova datoteka

Predmeti pokazani na ovoj datoteci

prikazuje

18 novembar 2005

vrsta medija na Internetu Serbian (Latin script)

image/png

kontrolna suma Srpski (transliteracija)

896104465de636e551cb77de82d0892e1e892551

veličina podatka Srpski (transliteracija)

32.749 Bajt

442 piksel

599 piksel

Historija datoteke

Kliknite na datum/vrijeme da biste vidjeli tadašnju verziju datoteke.

Datum/vrijemeMinijaturaDimenzijeKorisnikKomentar
aktualna01:14, 22 novembar 2019Minijatura verzije (01:14, 22 novembar 2019)599 × 442 (32 kB)MyridiumSomebody updated the image with a "2016" label that isn't even included in the data analysed! Data analysed only goes up to 2004.
08:54, 5 maj 2019Minijatura verzije (08:54, 5 maj 2019)599 × 500 (48 kB)TobusUpdate to show 2016 temperature anomaly
19:10, 16 juli 2014Minijatura verzije (19:10, 16 juli 2014)599 × 442 (32 kB)JeffyPShrinkin' the image.
00:51, 18 decembar 2005Minijatura verzije (00:51, 18 decembar 2005)599 × 442 (40 kB)Saperaud~commonswiki*'''Description:''' [[en:Image:{{subst:PAGENAME}}]]

Sljedeća stranica koristi ovu datoteku:

Globalna upotreba datoteke

Ovu datoteku upotrebljavaju i sljedeći projekti: